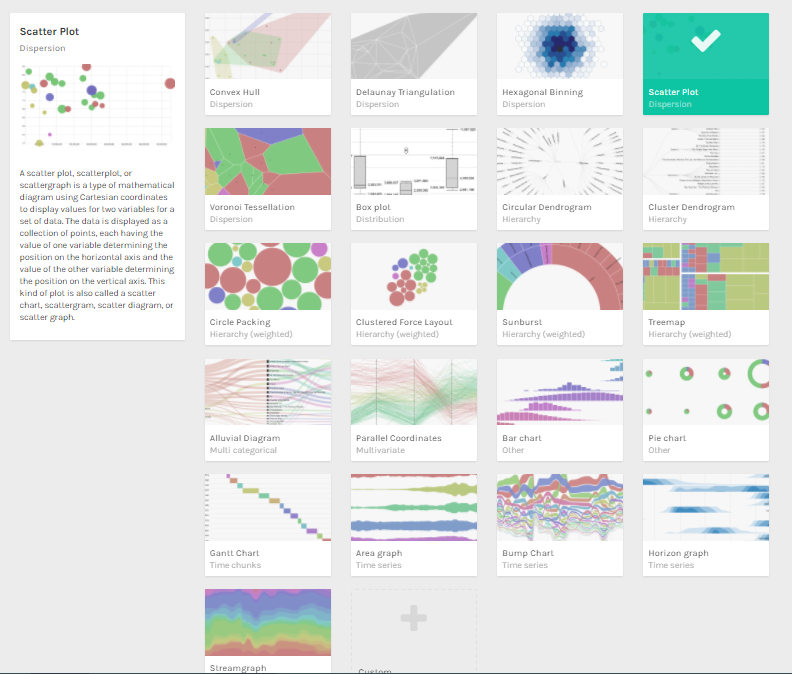
Some of the first ventures into the field now known as the Digital Humanities began when humanists wanted to use computers to read and analyze large bodies of text. Starting with Father Busa’s computer-readable project of Aquinas, today some of the most popular DH projects are text and data analysis-based. This tutorial highlights how to use and understand one of three unique analysis tools. RAWGraphs is an easy-to-use free online program that coverts highly quantitative data sets into visually attractive graphs. This tool is very easy to use so my tutorial feels almost unecesary, but as it is often unheard of, I will include it in the three-part text and data analysis series. Click the picture below to find the PDF tutorial!

One thought on “Text & Data Analysis Part 3: RAWGraphs Tutorial”